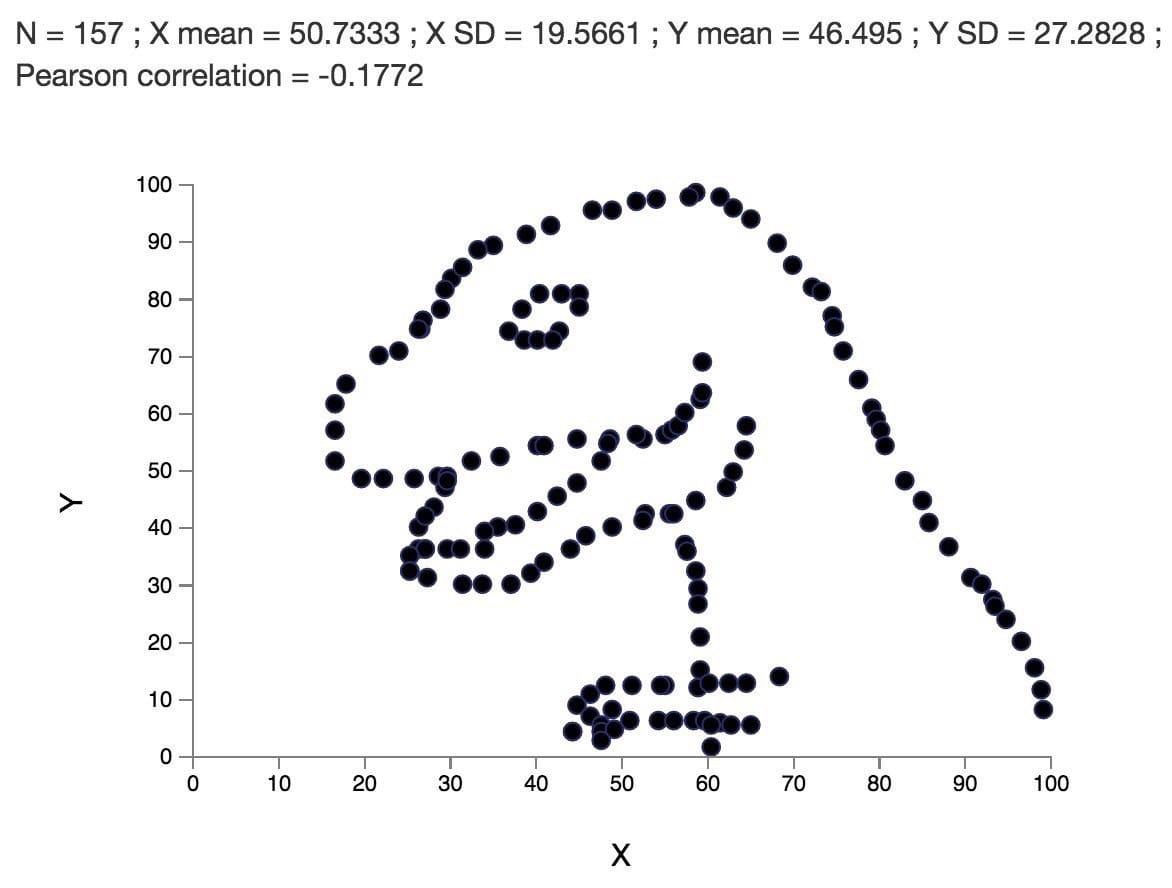
Scatter plot whose points form the outline of a dinosaur

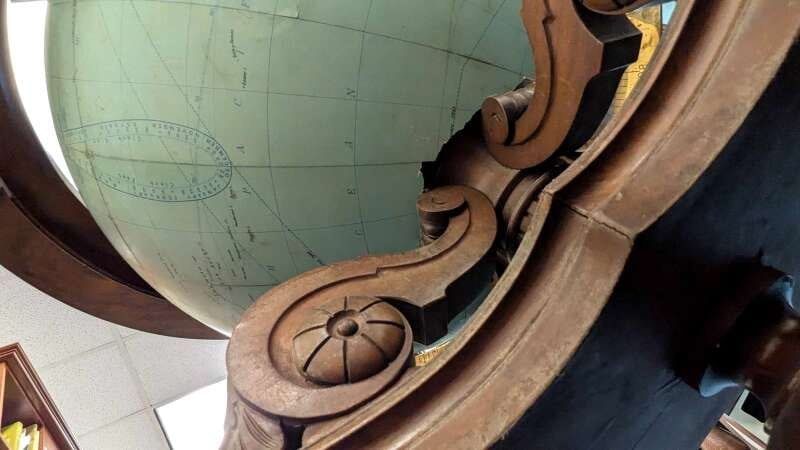
The staff of US Secretary of Defense Pete Hegseth have broken a globe that Dwight Eisenhower used during the Second World War. Hegseth was taken with the story of the globe, and his staff asked for it to be moved to the Secretary's office. Historic objects in the
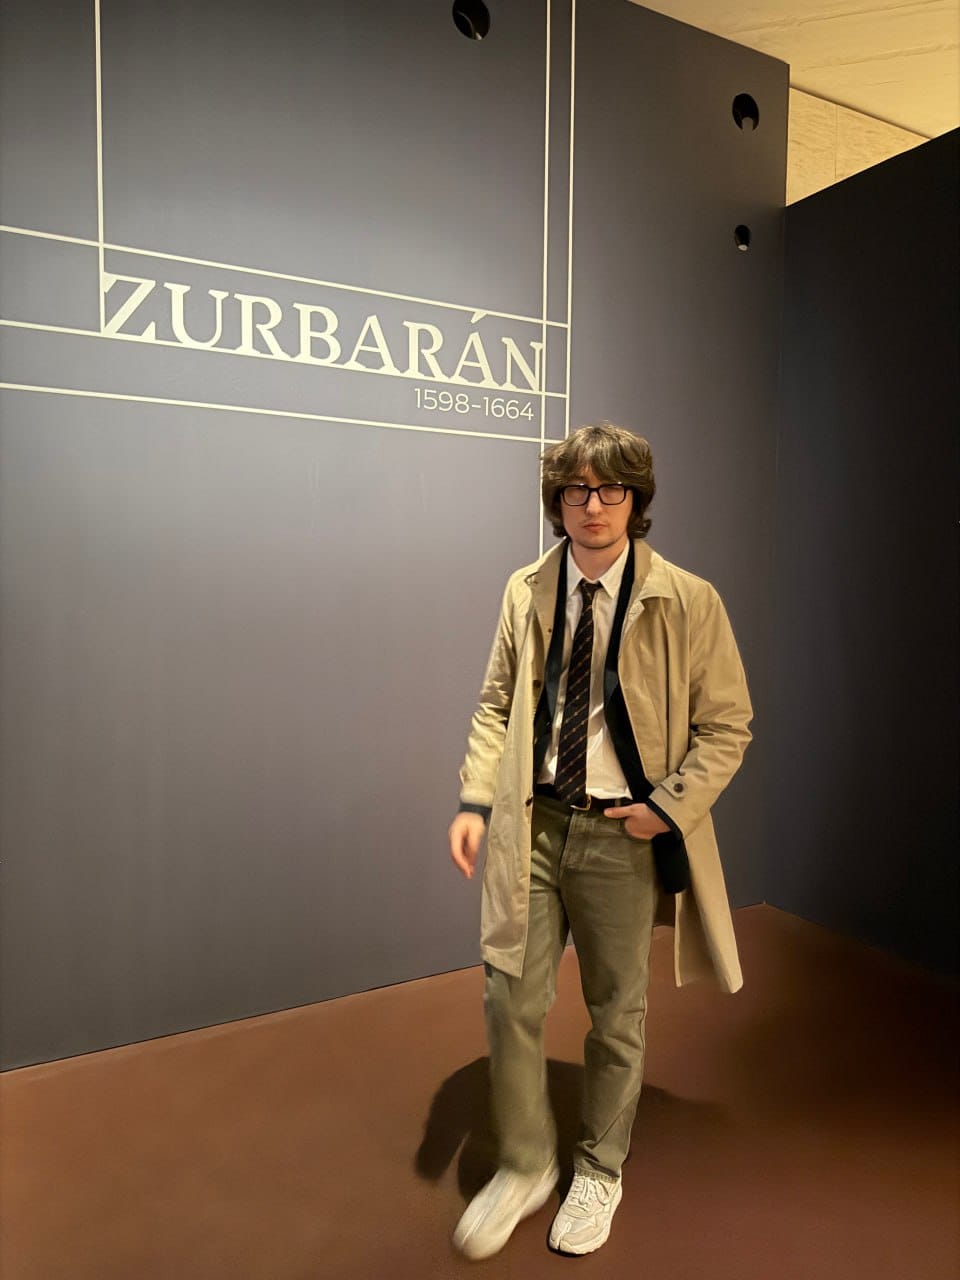
At the Zurbarán exhibition at the Louvre I made the acquaintance of Rossy de Palma. Everyone who has seen Almodóvar's films of the eighties and nineties knows her, from "Women on the Verge of a Nervous Breakdown" to "Kika". Madame Rosa Elena was invited

The Mausoleum is carried as a fixed asset, as are the sarcophagus and the equipment, while the clothing and the reagents count as materials. And Lenin himself, who takes no part in the production cycle and is not subject to depreciation, presumably sits in an off-balance-sheet account?
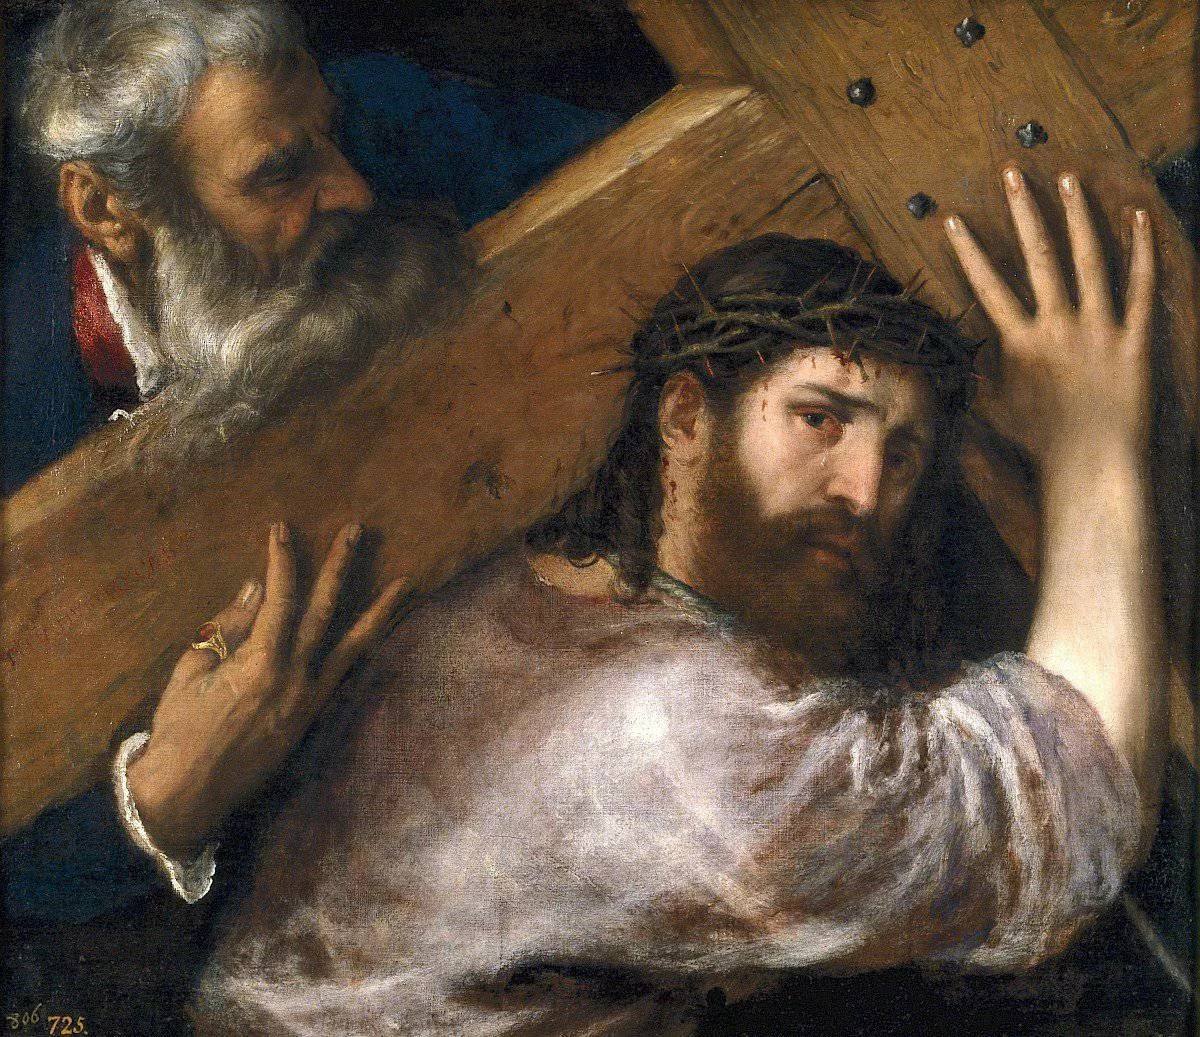
- And there's no cross round your neck - A cross? We bear our cross on our backs Leonid Andreyev